OBD2 scanners have revolutionized vehicle maintenance, placing the power of diagnostic insight directly into the hands of car owners and professionals alike. Among the most valuable capabilities these scanners offer is access to live data, a stream of real-time information straight from your vehicle’s engine and systems. But understanding how to effectively utilize this live data is key to truly unlocking the potential of your OBD2 scanner.
This guide will delve into the world of OBD2 live data, explaining what it is, the crucial types of data available, and most importantly, how to use live data on an OBD2 scanner to diagnose and maintain your vehicle with greater accuracy and efficiency.
Understanding Live Data from Your OBD2 Scanner
Live data, in the context of an OBD2 scanner, is a continuous flow of information transmitted by your vehicle’s sensors and control modules while the engine is running. Imagine it as a live health report for your car, constantly updating with vital signs like engine speed, sensor readings, and system voltages.
This real-time monitoring goes beyond simply reading error codes. Live data allows for a dynamic assessment of your vehicle’s health, enabling you to catch subtle anomalies and potential issues long before they escalate into major problems or trigger a trouble code.
For anyone looking to proactively maintain their vehicle or accurately diagnose a problem, understanding and utilizing live data is indispensable. The specific data points available will vary based on your vehicle’s make, model, and the capabilities of your OBD2 scanner, but the fundamental principles of interpretation remain consistent.
Key Types of Live Data and Their Diagnostic Significance
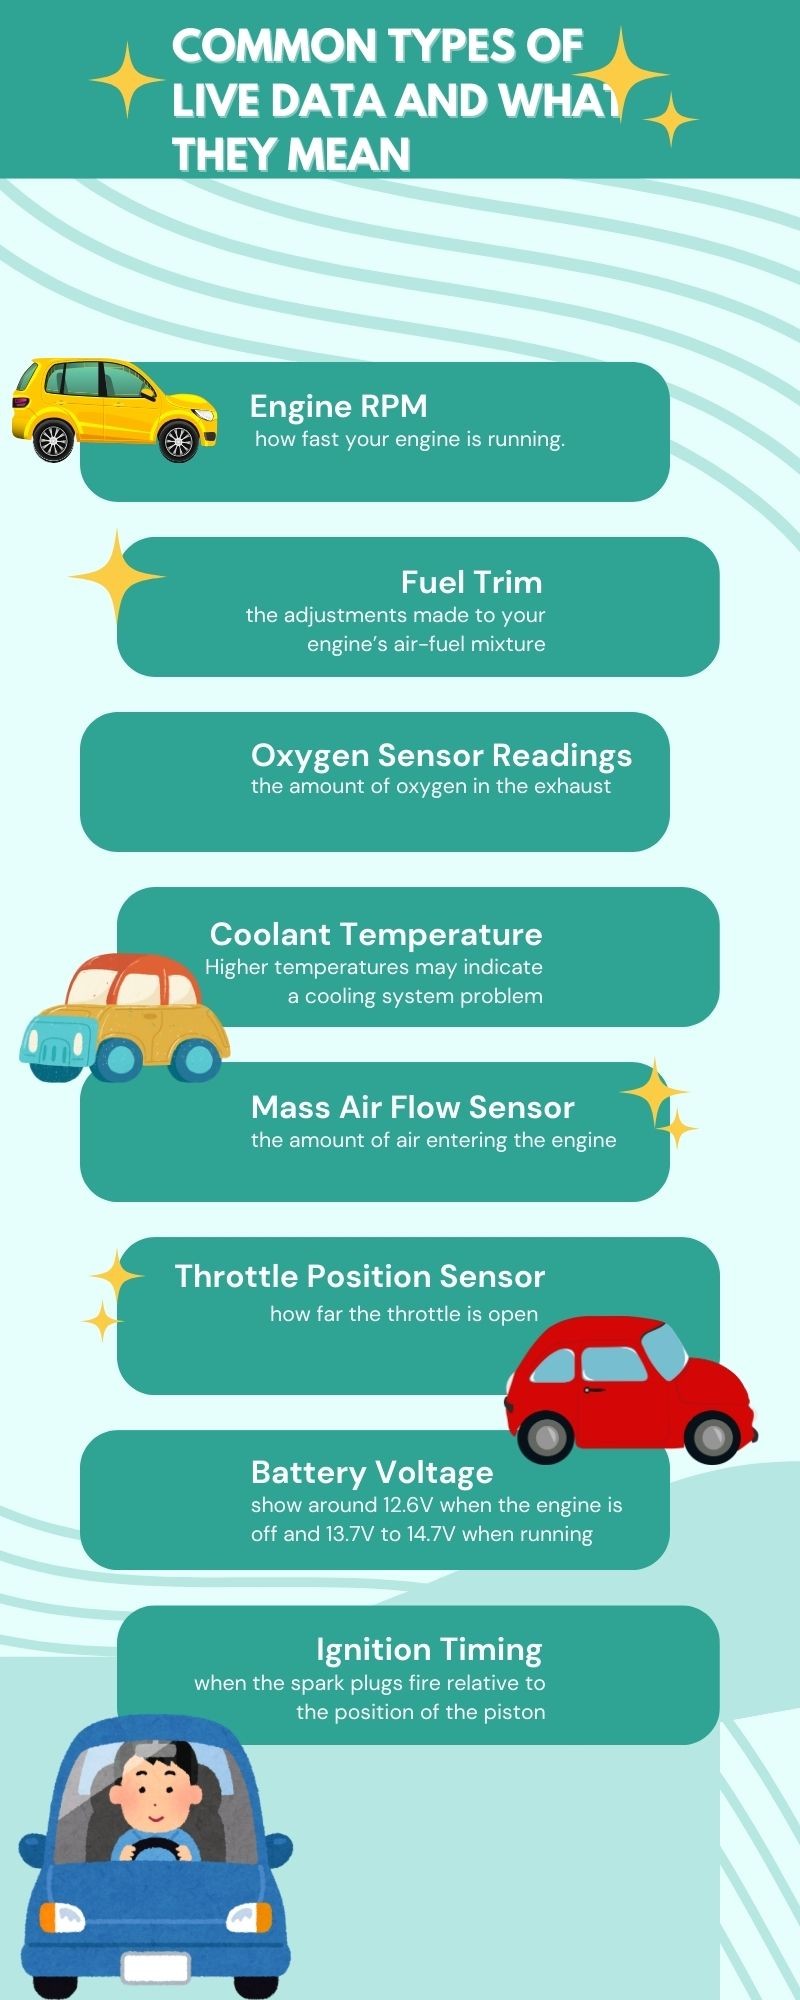
Your OBD2 scanner will present a wealth of live data parameters, each providing unique insights into your vehicle’s operational status. Here’s a breakdown of some of the most common and diagnostically significant live data types:
Engine RPM (Revolutions Per Minute): This indicates the engine’s rotational speed. Normal idle RPM varies by vehicle, but excessively high idle RPM could suggest issues like vacuum leaks affecting air intake or a malfunctioning idle air control valve.
Fuel Trim (Short Term & Long Term): Fuel trim reflects the Engine Control Unit’s (ECU) adjustments to the air-fuel mixture to maintain optimal combustion.
- Positive fuel trim (adding fuel) suggests a lean condition (too much air), possibly due to vacuum leaks, low fuel pressure, or a faulty Mass Air Flow (MAF) sensor.
- Negative fuel trim (reducing fuel) indicates a rich condition (too much fuel), potentially from issues like leaky fuel injectors, high fuel pressure, or a faulty oxygen sensor.
- Monitoring both short-term and long-term fuel trim helps differentiate between immediate adjustments and learned compensations, crucial for pinpointing the root cause.
Oxygen (O2) Sensor Readings: Oxygen sensors measure the oxygen content in the exhaust gas, providing feedback on combustion efficiency.
- Upstream O2 sensors (before the catalytic converter) should show rapid fluctuations, indicating the ECU is actively adjusting the air-fuel ratio. Slow or stuck readings can indicate a failing sensor.
- Downstream O2 sensors (after the catalytic converter) should show relatively stable readings. Erratic downstream readings might suggest catalytic converter inefficiency.
Coolant Temperature: This displays the engine coolant temperature. Overheating (temperatures exceeding the normal range, typically 190°F-220°F or 88°C-104°C) can indicate serious cooling system problems such as a faulty thermostat, failing radiator fan, or coolant leaks. Consistently low temperatures might also indicate a thermostat issue.
Mass Air Flow (MAF) Sensor: The MAF sensor measures the volume of air entering the engine. Incorrect readings can lead to various performance and fuel efficiency problems.
- Low MAF readings could indicate a dirty or failing sensor, restricting airflow.
- Comparing expected MAF values at different engine loads (idle vs. acceleration) with live data helps assess sensor accuracy.
Throttle Position Sensor (TPS): The TPS indicates the throttle valve opening angle, reflecting driver input and engine load demand.
- Erratic TPS readings can cause issues like hesitation, stalling, or poor acceleration.
- Smooth and consistent TPS data correlating with pedal input is expected.
Battery Voltage: This monitors the vehicle’s battery voltage.
- A healthy battery at rest should read around 12.6V.
- While running, with the alternator charging, voltage should typically be between 13.7V and 14.7V.
- Low voltage when running can indicate alternator problems, while consistently low voltage even when off points to battery issues. High voltage could suggest a faulty voltage regulator.
Ignition Timing: Ignition timing data reveals when the spark plugs fire in relation to piston position.
- Incorrect timing can lead to performance issues like engine knocking (pinging), reduced power, or poor fuel economy.
- Advanced timing (firing spark plugs earlier) is often used for better performance, while retarded timing might be used to prevent knocking.
Understanding these common live data parameters is the first step in effectively utilizing your OBD2 scanner for vehicle diagnostics.
Effectively Reading and Interpreting OBD2 Live Data
Interpreting live data effectively involves more than just noting down numbers. It’s about understanding the context, recognizing patterns, and comparing readings against expected values. Here’s how to approach live data interpretation:
Establish Baseline Values: Familiarize yourself with the normal operating ranges for your vehicle’s sensors. Your vehicle’s repair manual or reliable online resources specific to your car’s make and model are excellent sources for baseline values. Knowing what’s “normal” allows you to quickly identify deviations.
Focus on Trends and Patterns: Don’t get fixated on single, isolated readings. Look for trends and patterns in the data stream. For example, a coolant temperature that gradually climbs too high during normal driving is more concerning than a momentary spike. Similarly, consistently high fuel trim values are more significant than occasional fluctuations.
Utilize Freeze Frame Data: Freeze frame data is invaluable for diagnosing intermittent problems. When a Diagnostic Trouble Code (DTC) is triggered, the ECU often captures a “snapshot” of sensor readings at that precise moment. This freeze frame data provides crucial context for understanding the conditions present when the fault occurred. Reviewing freeze frame data associated with a check engine light can significantly narrow down the potential causes.
Compare Data Under Different Conditions: Analyze live data under various driving conditions – idle, acceleration, cruising, deceleration. For example, MAF sensor readings should increase predictably with engine RPM. Discrepancies between expected and actual data under different conditions can pinpoint specific component malfunctions.
Diagnosing Common Vehicle Issues Using Live Data
Live data is a powerful tool for diagnosing a wide range of vehicle problems, often providing more granular insights than error codes alone. Here are practical examples of how to use live data on an OBD2 scanner for common issues:
Check Engine Light Diagnostics: When the check engine light illuminates, retrieving the DTC is just the starting point. Live data can validate the code and provide deeper context. For instance, a DTC indicating an oxygen sensor issue can be further investigated with live O2 sensor data to determine if the sensor is truly faulty or if the code is triggered by a related problem like a fuel mixture imbalance (evident in fuel trim data).
Intermittent Performance Problems (Misfires, Hesitation): Intermittent issues are notoriously difficult to diagnose with error codes alone. Live data monitoring during driving can capture the transient conditions causing the problem. Observe parameters like:
- Engine RPM and TPS: To see if the issue is related to throttle input or engine load changes.
- Fuel Trim and O2 Sensors: To identify potential fuel delivery or air intake problems causing misfires or hesitation.
- Ignition Timing: To rule out timing-related misfires.
Fuel Efficiency Issues: If you notice a sudden drop in fuel economy, live data can help identify potential culprits:
- MAF Sensor: A faulty MAF sensor underreporting airflow can cause the ECU to inject too much fuel, reducing efficiency.
- O2 Sensors: Failing O2 sensors can lead to incorrect air-fuel ratio calculations, impacting fuel economy.
- Coolant Temperature: An engine running too cold (due to a faulty thermostat) can also reduce fuel efficiency.
Overheating Problems: Live data is crucial for diagnosing cooling system malfunctions before severe engine damage occurs:
- Coolant Temperature: Monitor temperature trends during warm-up and normal driving to detect overheating.
- Radiator Fan Operation: Some advanced scanners can show radiator fan relay status, verifying fan operation.
- Transmission Temperature (if supported): Overheating transmissions can also be diagnosed by monitoring transmission fluid temperature data.
By strategically using live data, you can move beyond guesswork and adopt a more targeted and efficient approach to vehicle diagnostics and repair.
Conclusion: Mastering Live Data for Vehicle Health
Understanding and utilizing live data from your OBD2 scanner empowers you to take a proactive role in your vehicle’s maintenance and repair. By learning how to interpret key data parameters, recognize patterns, and apply this information to diagnose common issues, you gain a significant advantage in maintaining your vehicle’s optimal performance and longevity.
Whether you are a seasoned car enthusiast or a daily driver seeking to understand your vehicle better, mastering the use of live data is an invaluable skill that can save you time, money, and frustration in the long run.
FAQs About OBD2 Live Data
Why is freeze frame data important for diagnostics?
Freeze frame data captures a snapshot of crucial sensor readings at the moment a DTC is triggered. This is vital for diagnosing intermittent faults because it provides context about the vehicle’s operating conditions when the problem occurred, even if the issue is not constantly present.
Which OBD-II mode displays real-time sensor data?
OBD-II Mode 1 is specifically designed to display current, real-time data parameters from the vehicle’s sensors and systems. This mode is the primary source for accessing live data on your OBD2 scanner.
What types of diagnostic trouble codes trigger freeze frame data?
Freeze frame data is typically stored when emission-related DTCs are set, primarily P-codes (Powertrain codes). These codes relate to engine, transmission, and emission control systems, which are critical for vehicle performance and environmental compliance.